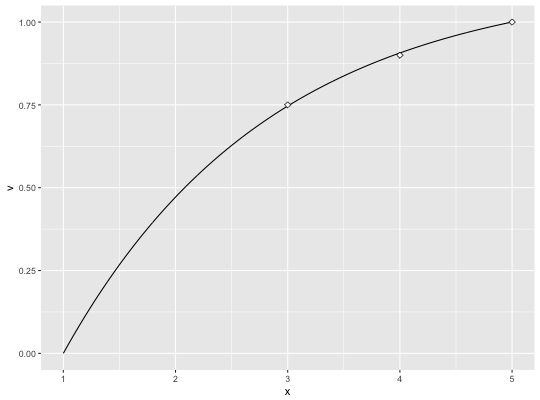
Plot the single attribute value curve
SAVF_plot plots the single attribute value curve along with the
subject matter desired values for comparison
SAVF_plot(desired_x, desired_v, x_low, x_high, rho)
Arguments
- desired_x
Elicited input x value(s)
- desired_v
Elicited value score related to elicited input value(s)
- x_low
Lower bound anchor point (can be different than
min(x))- x_high
Upper bound anchor point (can be different than
max(x))- rho
Exponential constant for the value function
Value
A plot that visualizes the single attribute value curve along with the subject matter desired values for comparison
See also
SAVF_plot_rho_error for plotting the rho squared error terms
SAVF_score for computing the exponential single attribute value score
Examples
# Given the single attribute x is bounded between 1 and 5 and the subject matter experts
# prefer x values of 3, 4, & 5 provide a utility score of .75, .90 & 1.0 respectively,
# the preferred rho is 0.54. We can visualize this value function:

SAVF_plot(desired_x = c(3, 4, 5),
          desired_v = c(.75, .9, 1),
          x_low = 1,
          x_high = 5,
          rho = 0.54)